Observability in Clojure
Observability in cloud-native applications is crucial for managing complex systems and ensuring reliability (Chakraborty & Kundan, 2021; Kosińska et al., 2023). It enables continuous generation of actionable insights based on system signals, helping teams deliver excellent customer experiences despite underlying complexities (Hausenblas, 2023; Chakraborty & Kundan, 2021). In essence, adding proper observability to your system allows you to find and diagnose issues without having to dig through tons of unstructured log files.
The running project
In my previous post on reitit we built a simple endpoint using Clojure and reitit. The complete code for the small project was:
clojure code snippet start
(ns core
  (:require
   [reitit.ring :as ring]
   [ring.adapter.jetty :as jetty]))

(defn handler [request]
  {:status 200
   :body (str "Hello world!")})

(def router (ring/router
             ["/hello" {:get #'handler}]))

(def app (ring/ring-handler router
                            (ring/create-default-handler)))
clojure code snippet end
Nice and easy eh? That simplicity is what I truly love about Clojure . That, and the fact that there is an awesome interoperability with the Java ecosystem of libraries.
Adding observability
In Clojure it is possible to add observability through the wonderful clj-otel library by Steffan Westcott. It implements the OpenTelemetry standard which makes it integrate nicely in products such as HoneyComb.io and Jaeger.
The library has a great tutorial that you can follow here. Applying the knowledge from this tutorial to our reitit application is also trivial. To show the power of observability a JDBC connection will be added to the application. It is not necessary to mess with any tables or such, it will just leverage a connection to a Postgres database and a value will be queried from it.
First, lets see the updated deps.edn file.
clojure code snippet start
{:deps {ring/ring-jetty-adapter {:mvn/version "1.13.0"}
        metosin/reitit {:mvn/version "0.7.2"}

        ;; Observability
        com.github.steffan-westcott/clj-otel-api {:mvn/version "0.2.7"}

        ;; Database access
        com.github.seancorfield/next.jdbc {:mvn/version "1.3.981"}
        org.postgresql/postgresql {:mvn/version "42.7.4"}
        com.zaxxer/HikariCP {:mvn/version "6.2.1"}}

 :aliases {:otel {:jvm-opts ["-javaagent:opentelemetry-javaagent.jar"
                             "-Dotel.resource.attributes=service.name=blog-service"
                             "-Dotel.metrics.exporter=none"
                             ]}}}
clojure code snippet end
You will notice some new dependencies, as well as an alias that you can use to start the repl with. If you, like me, use Emacs you can codify this into a .dir-locals.el file for your project.
emacs-lisp code snippet start
((nil . ((cider-clojure-cli-aliases . ":otel"))))emacs-lisp code snippet end
Now, whenever cider creates a new repl it will use the otel alias as well.
The agent that is listed as javaagent can be downloaded from the OpenTelemetry Java Instrumentation page. This will immediately bring in a slew of default instrumentations to the project. Give it a try with the starter project, you will notice that all the jetty requests will show up in your jaeger instance (you did look at the tutorial, right?).
Finally, here is the update project for you to play with.
clojure code snippet start
(ns core
  (:require
   [next.jdbc :as jdbc]
   [reitit.ring :as ring]
   [ring.adapter.jetty :as jetty]
   [ring.util.response :as response]
   [steffan-westcott.clj-otel.api.trace.http :as trace-http]
   [steffan-westcott.clj-otel.api.trace.span :as span]))

(def counter (atom 0))

;; add your database configuration here
(def db {:jdbcUrl "jdbc:postgresql://localhost:5432/db-name?user=db-user&password=db-pass"})

(def ds (jdbc/get-datasource db))

(defn wrap-db
  [handler db]
  (fn [req]
    (handler (assoc req :db db))))

(defn wrap-exception [handler]
  (fn [request]
    (try
      (handler request)
      (catch Throwable e
        (span/add-exception! e {:escaping? false})
        (let [resp (response/response (ex-message e))]
          (response/status resp 500))))))

(defn db->value [db]
  (let [current @counter]
    (span/with-span! "Incrementing counter"
      (span/add-span-data! {:attributes {:service.counter/count current}})
      (swap! counter inc))
    (:value (first (jdbc/execute! db [(str "select " current " as value")])))))

(defn handler [request]
  (let [db (:db request)
        dbval (db->value db)]
    (span/add-span-data! {:attributes {:service.counter/count dbval}})
    {:status 200
     :body (str "Hello world: " dbval)}))

(def router (ring/router
             ["/hello" {:get (-> #'handler
                                 (wrap-db ds)
                                 wrap-exception
                                 trace-http/wrap-server-span)}]))

(def app (ring/ring-handler router
                            (ring/create-default-handler)))

(def server (jetty/run-jetty #'app {:port 3000, :join? false}))
;; (.stop server)
clojure code snippet end
There are several interesting bits to be aware of. First the handler is wrapped in several middleware functions, one to pass the database connection, the other to wrap the exceptions (such as in the tutorial) and finally the middleware to wrap a server request. The db->value creates its own span to keep track of its activity.
After making several requests you will see that Jaeger contains the same amount of traces. A normal trace will show 3 bars, each of which you can expand and explore.

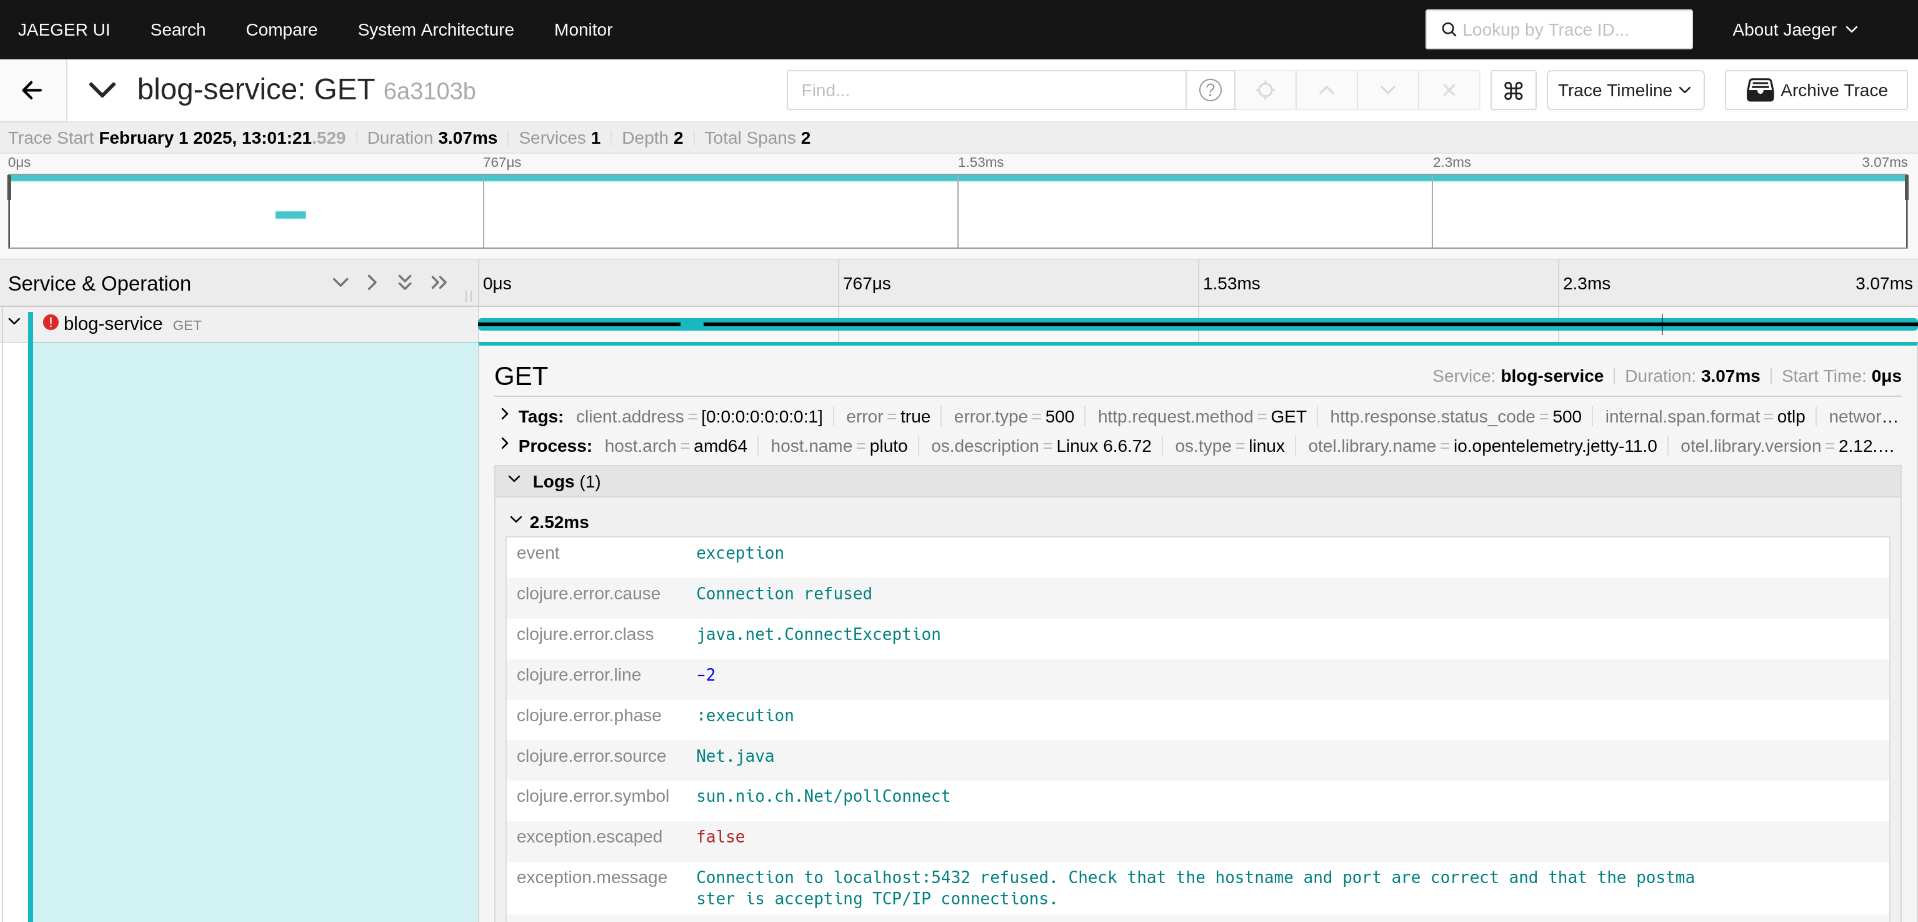
If you take the database offline (that is why we used Postgres), you will notice that the exception is neatly logged.

Observability allows you to get a great insight into how you application is running in production. With the clj-otel library it is a breeze to enhance your own application.